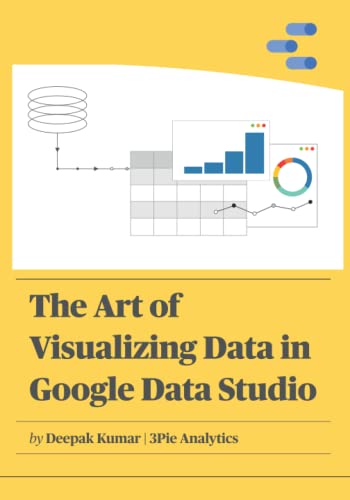
The Art of Visualizing Data in Google Data Studio: Create graphs, manage data and extrapolate results for presentations, reports and guides with the help of this easy-to-follow explanation
- Length: 139 pages
- Edition: 1
- Language: English
- Publisher: Independently published
- Publication Date: 2022-01-06
- ISBN-10: B09PVNSL3D
- ISBN-13: 9798796413265
- Sales Rank: #0 (See Top 100 Books)
Introduction:
What would you expect to learn from this book?
With a detailed yet user-friendly guide, experts and novices alike can learn how best to utilize the extensive tools available within Google Data Studio. Create graphs, manage data and extrapolate results for presentations, reports and guides with the help of this easy-to-follow explanation.
Why do we need data visualization?
Right now, Data Visualization is a hot commodity. Whether you’re a small business owner looking to create financial reports or a PhD student finalizing an important piece of research, it’s vital to make sure the charts and graphs you use to display data are clear, easy to understand and visually appealing.
It’s no longer enough to simply visually display data in complex, hard to read spreadsheets. Properly visualized data is easy to understand for all of your audiences and can help make important trends clear. From this, analytics and full guides can be created, appealing to everyone from the CEO right through to your day-to-day clients or other stakeholders.
However you intend to use it, it’s more important than ever that you understand Data Visualization, and this is the guide to help.
Why use Google Data Studio – brings your data to life
- Google Data Studio is the tool to bring your data to life. Bring in figures and research from multiple sources across the internet, including social networking sites such as Facebook and Twitter.
- It’s also the tool to help transform this information. Easy to use yet sufficiently advanced for professional level reporting, Google Data Studio allows you to tell stories with your information — including high-level reports and easy-to-update digital dashboards.
- Finally, Google Data Studio allows you and your audiences to gain meaningful insights from raw data. From this, the conclusions you draw will create genuine action for your organization.
Donate to keep this site alive
1. Disable the AdBlock plugin. Otherwise, you may not get any links.
2. Solve the CAPTCHA.
3. Click download link.
4. Lead to download server to download.


